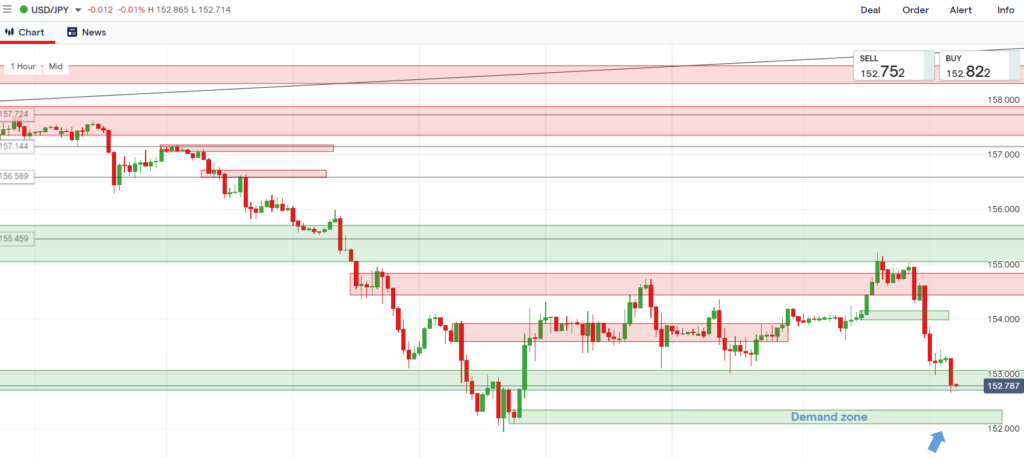
Analysis Using Top-Down Approach
Daily Timeframe
The trend is an uptrend. Look to enter for a buy.
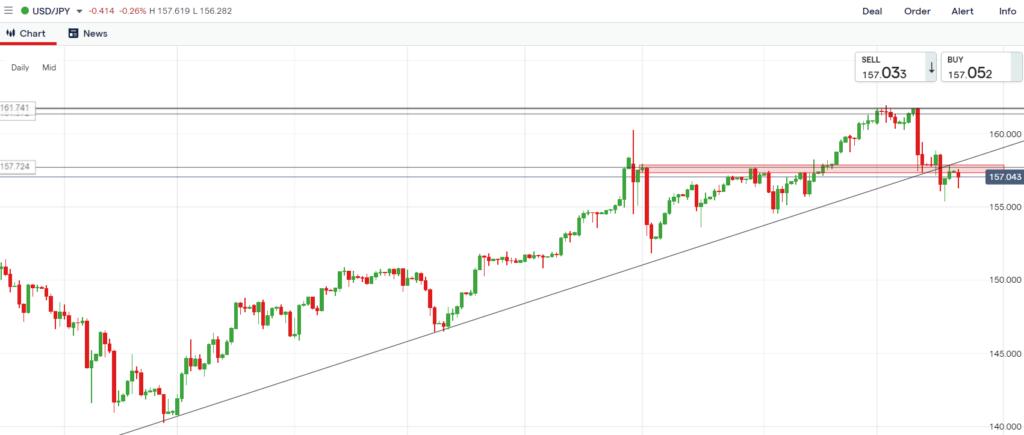
Update
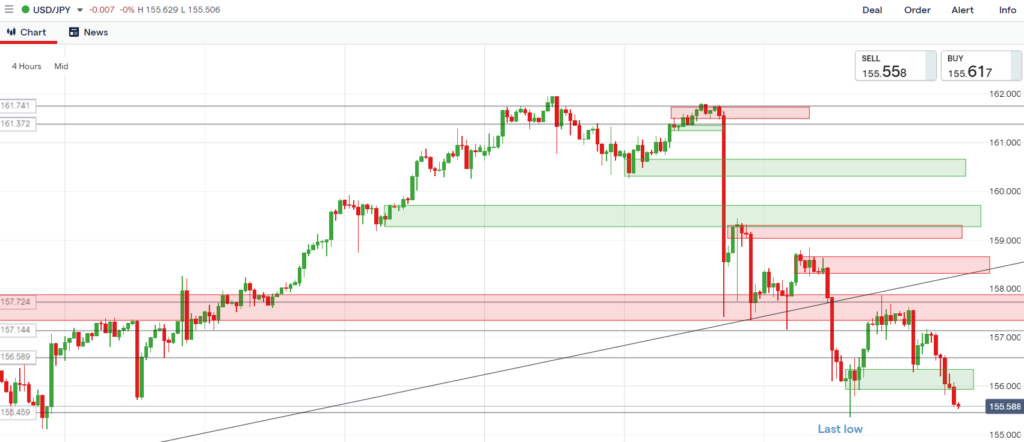
Wait and see where the price is going as it is at the last swing low. The price might break through the last swing low or go up, i.e. finished re-tracing, from here. Do not do anything at this point.
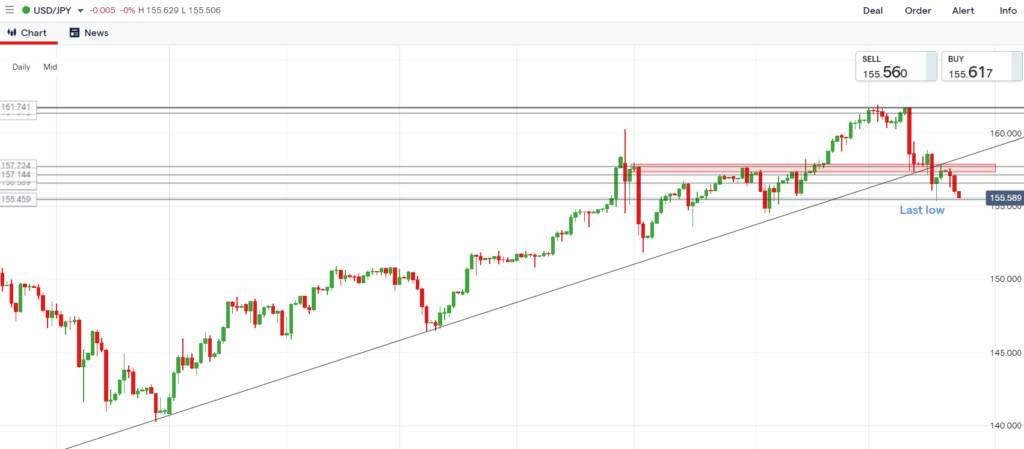
Update
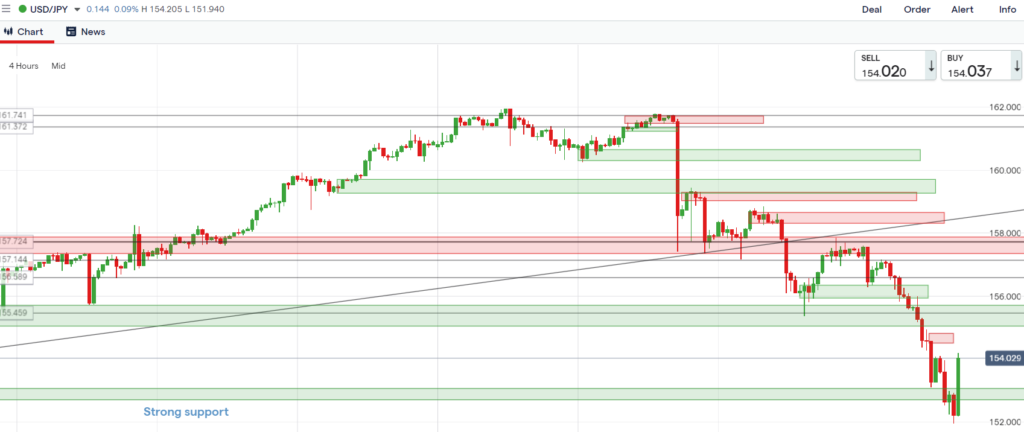
The price is bearish and going to reach the strong support area. Wait and see where the price is going. Do not do anything at this point.
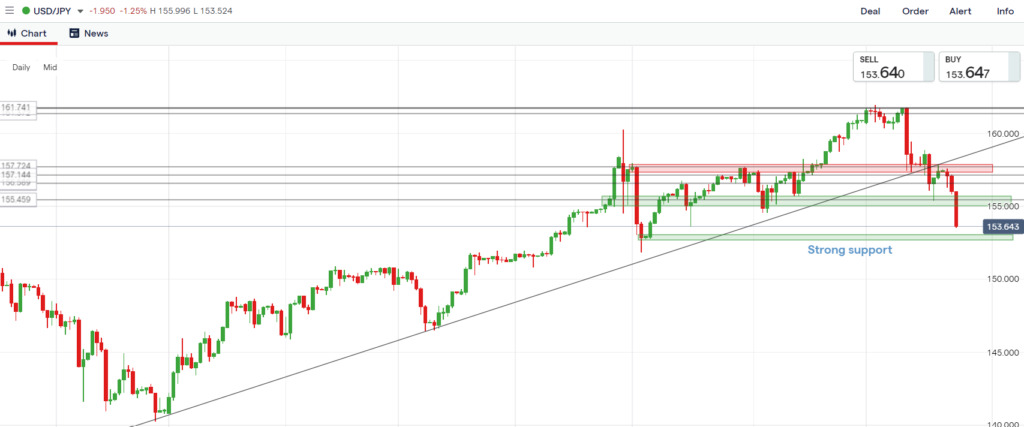
Update
Price has reached the strong support and is potentially reversing. Look to enter for a buy position.
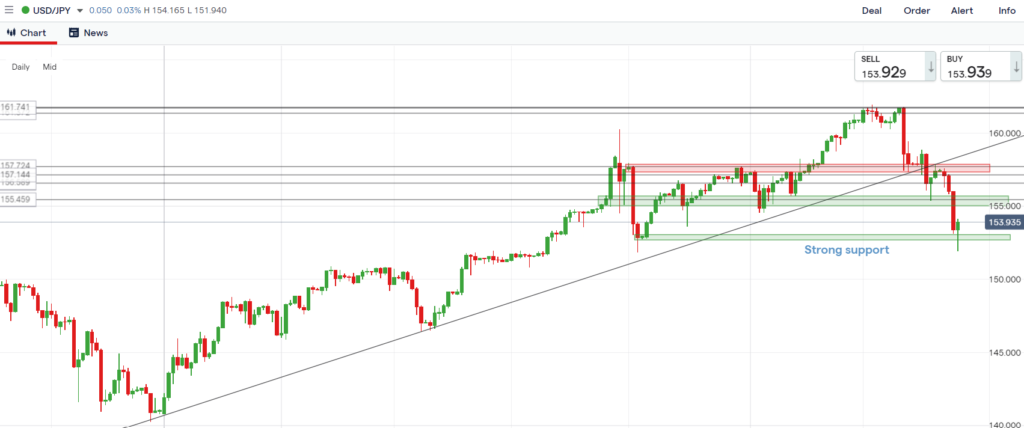
Update
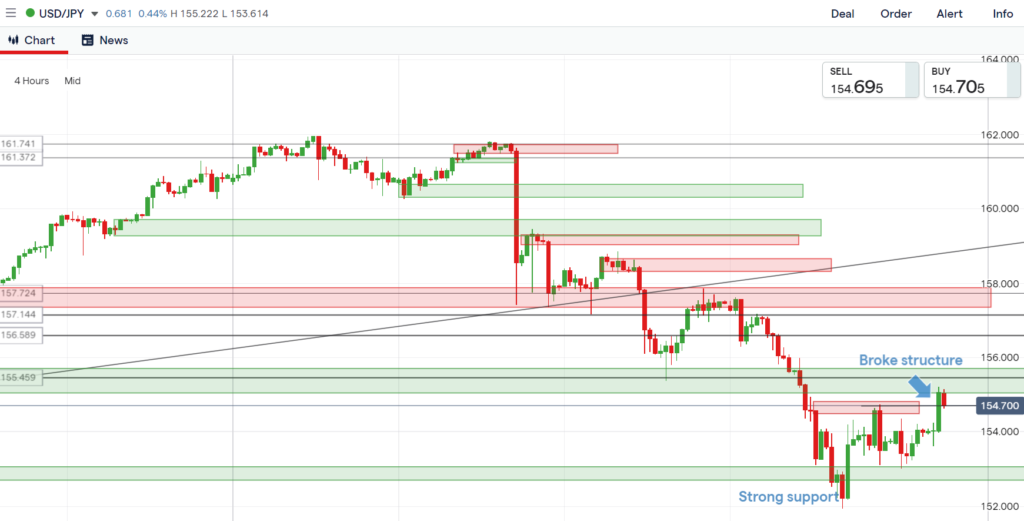
From what I see, price has reversed as it has broke the structure.
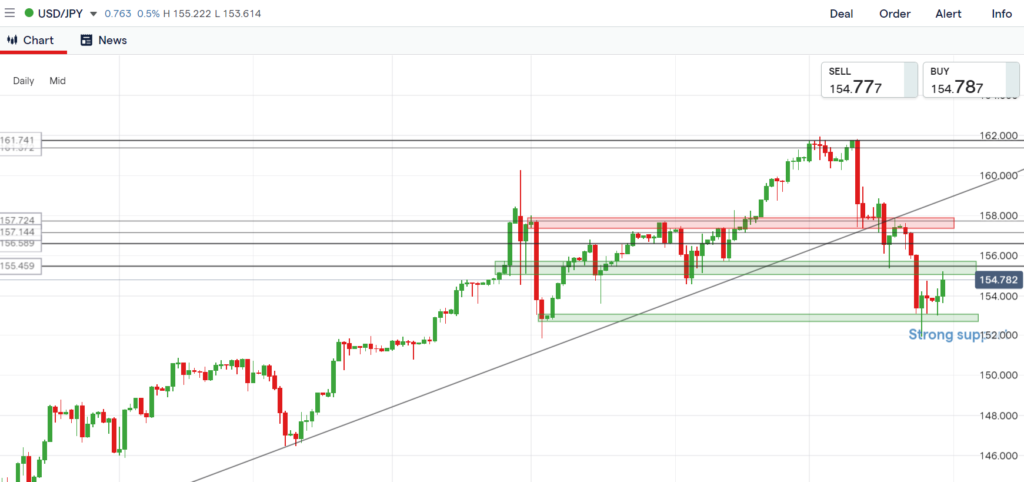
Update
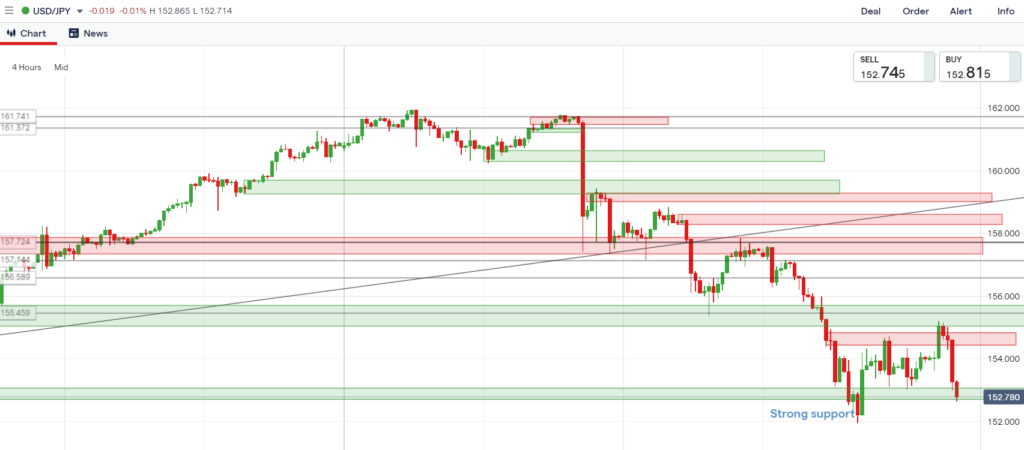
The price is bearish and reaching the strong demand zone to re-test the level. May look to enter for a buy. Wait and see what price is doing before entering the trade.
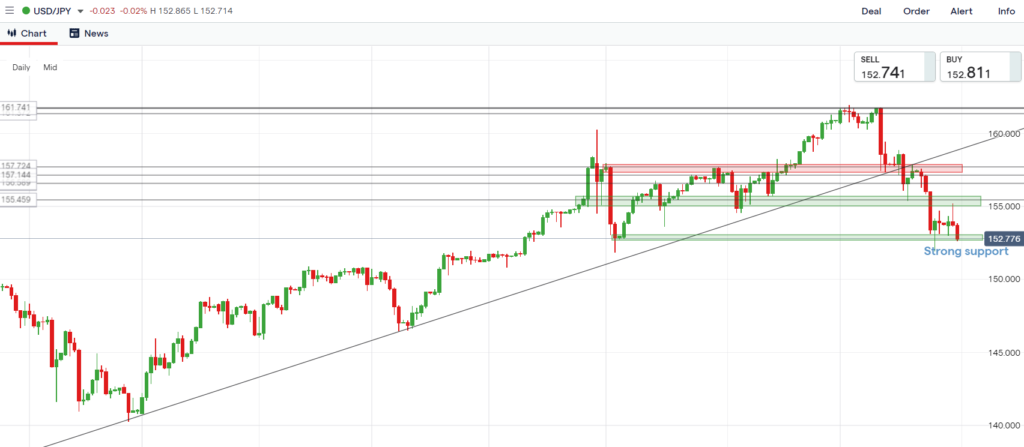
4 Hours Timeframe
The price has failed to break through the last low and has formed a higher low. It has potentially finished re-tracing and the trend is reversing to become an uptrend. Wait and see what the price will do.
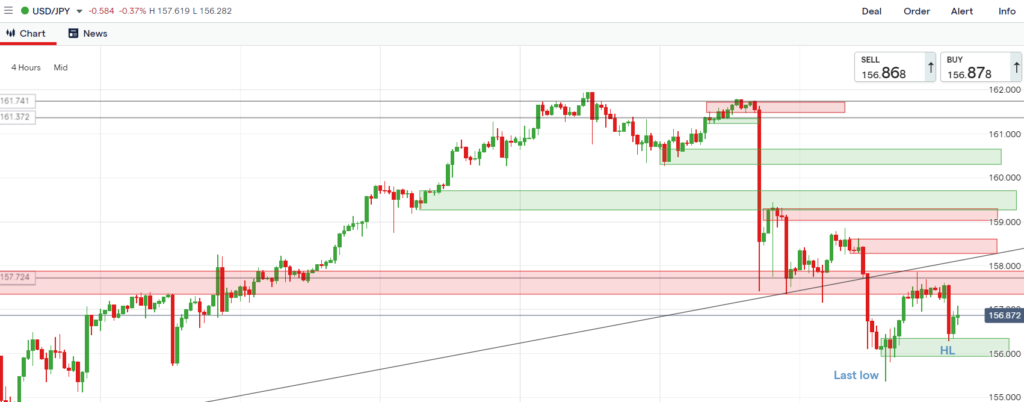
Update
Wait and see.
Update
Wait to enter for a buy.
Update
Price has broke structure. Look to enter for a buy position.
Update
Wait and see to enter for a buy.
1 Hour Timeframe
If the price breaks through the last high, enter for a buy position. However, the last high zone is also a very strong resistance level on the Daily timeframe, where liquidation happened.
Wait and see before entering for a trade.
Set alert to buy at 157.866.
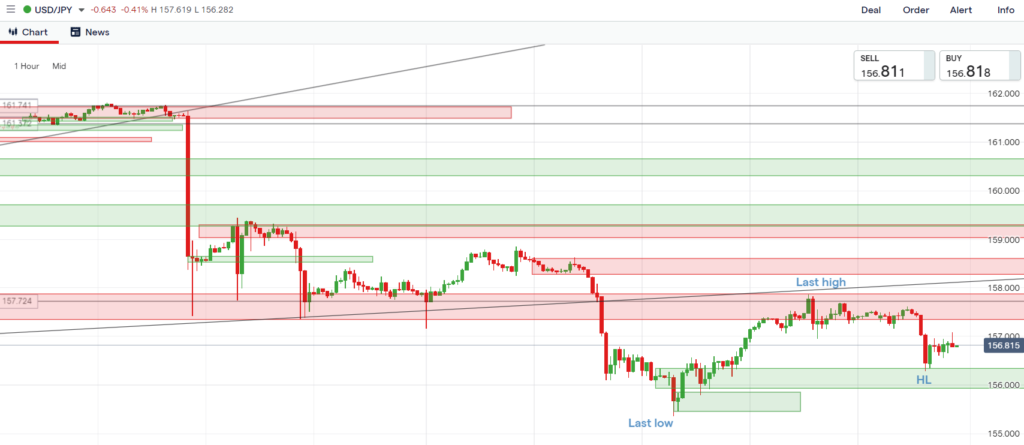
Update
Wait and see where the price is going. If the price breaks through the last low, enter for a sell.
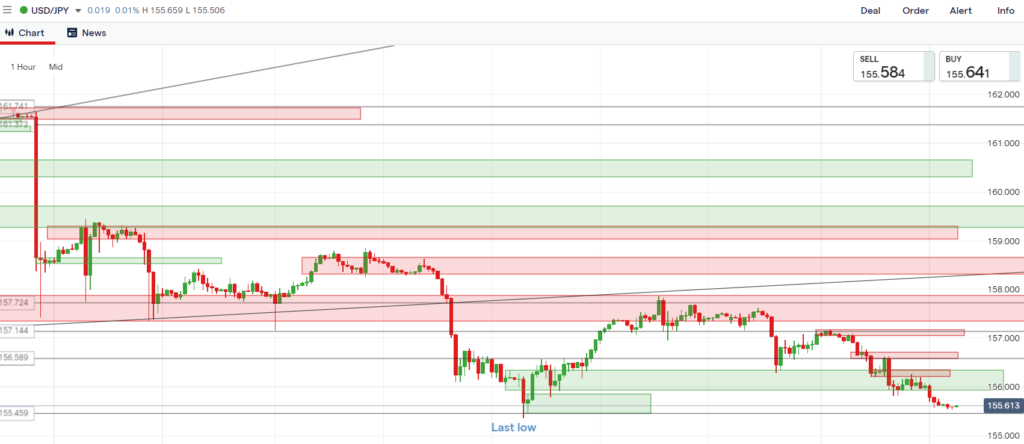
Update
Wait for the price to retrace back to retest the strong support zone, then enter for a buy.
Set alert at 152.98.
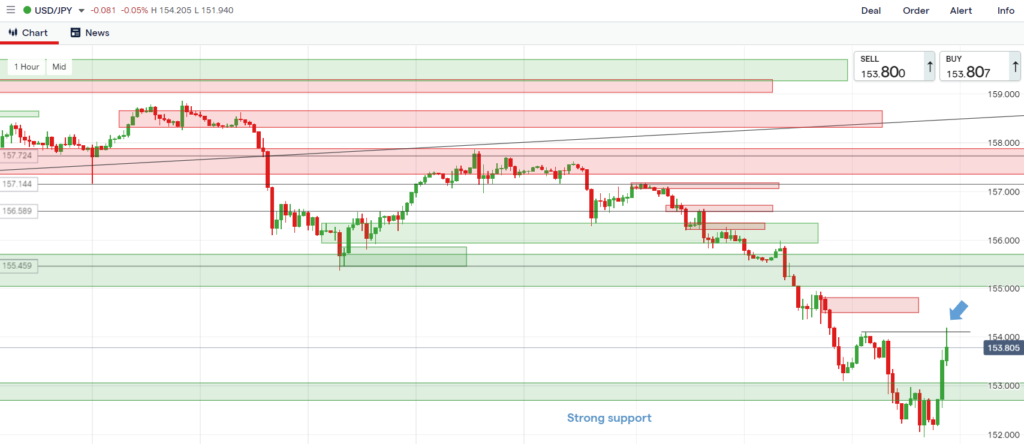
Update
Wait for the price to retrace back to the demand zone, then enter for a buy.
Set alert at 154.355 (triggered).
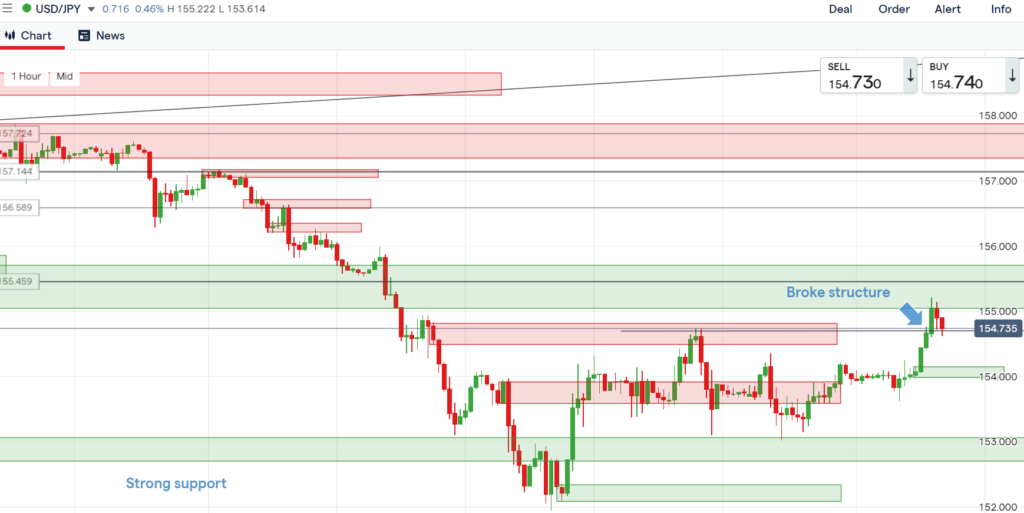
Update
The price might come down to re-test the demand zone, which is not mitigated yet. Wait and see.
