Bought: 158.02
Stop-out: 157.883
Loss: $117.04
Analysis Using Top-Down Approach
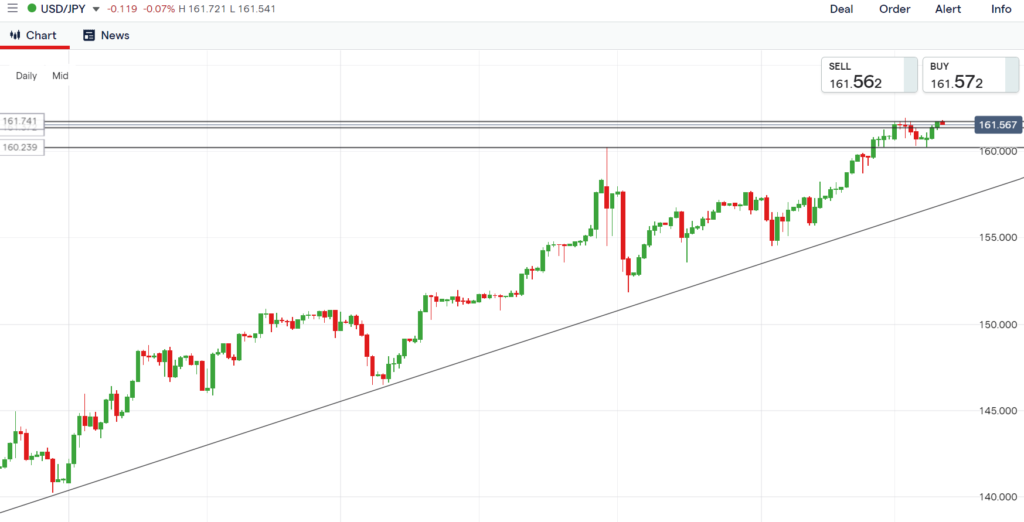
Daily Timeframe
Overall market structure is an uptrend, with higher highs and higher lows.
Update
Price has come down to the major key level, where the trendline is. Overall market structure is in an uptrend. Look to enter for a buy.
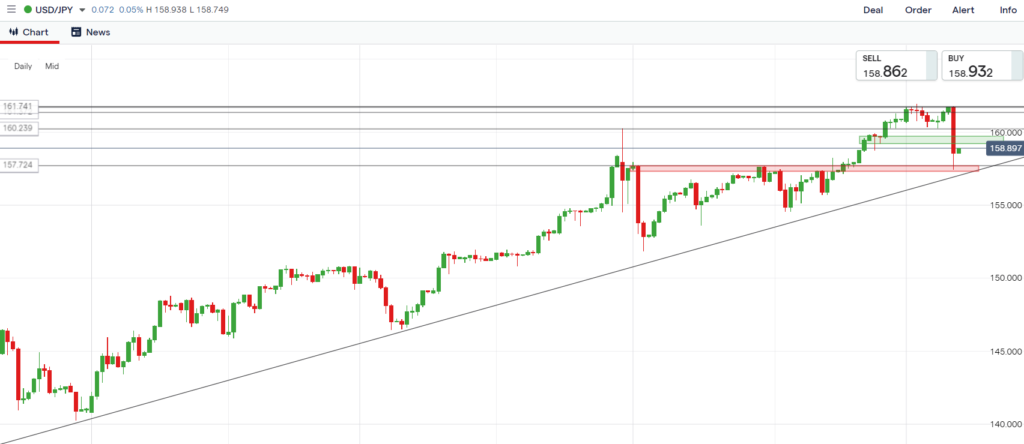
Daily timeframe on 15 July. Price is still bearish.

4 Hours Timeframe
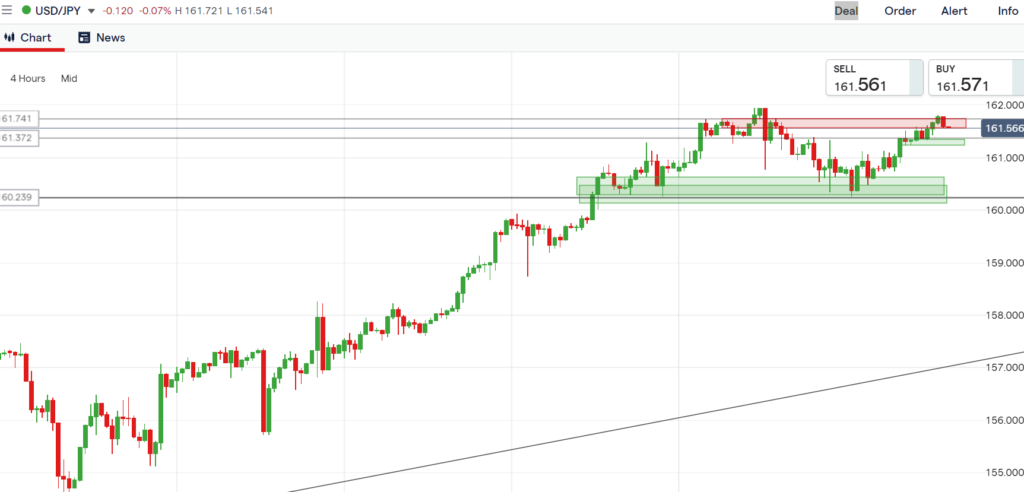
The overall trend is bullish in the 4 hours timeframe.
Update
Price has come down to the major key level. This is where the trendline is.
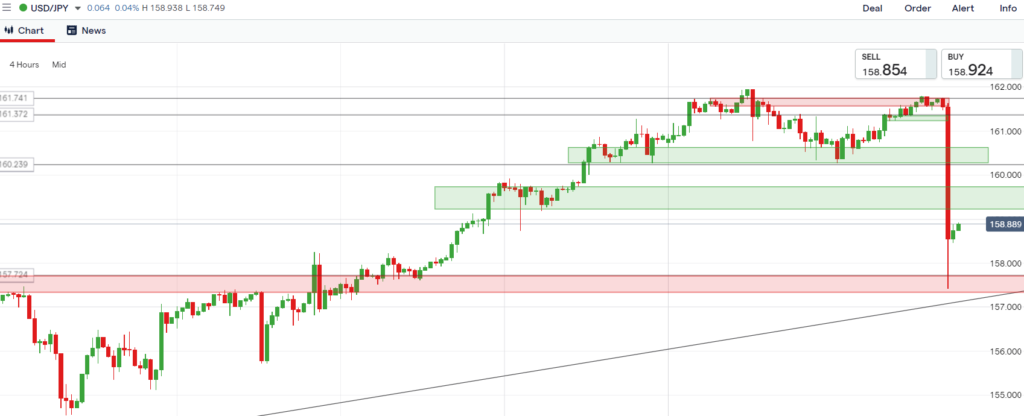
4 hours timeframe on 15 July. Price has come back down to the major key support level, where the trendline is. Price is still bearish.
1 Hour Timeframe
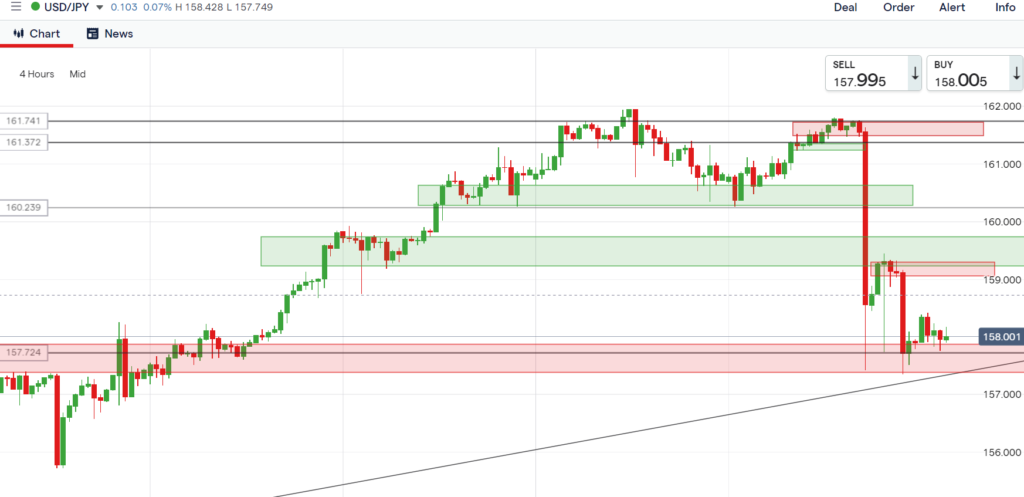
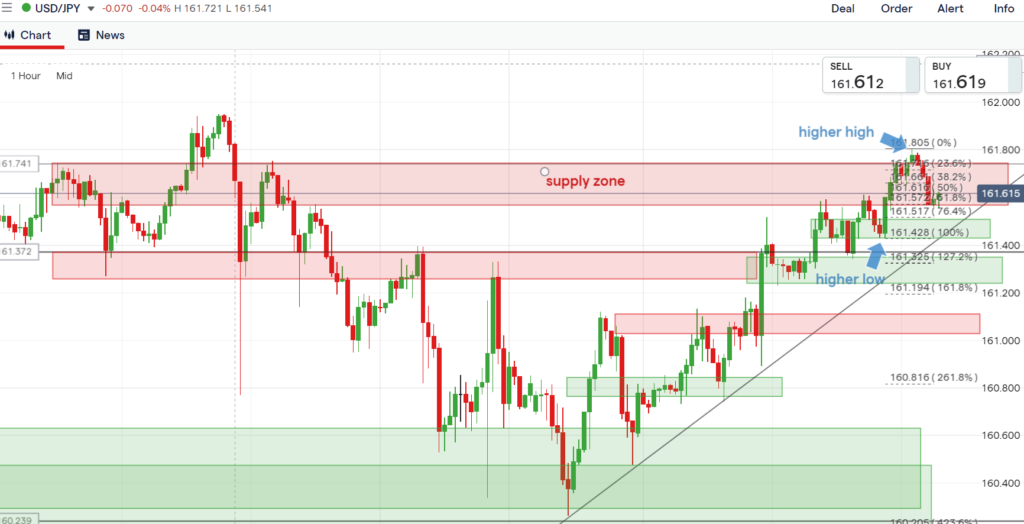
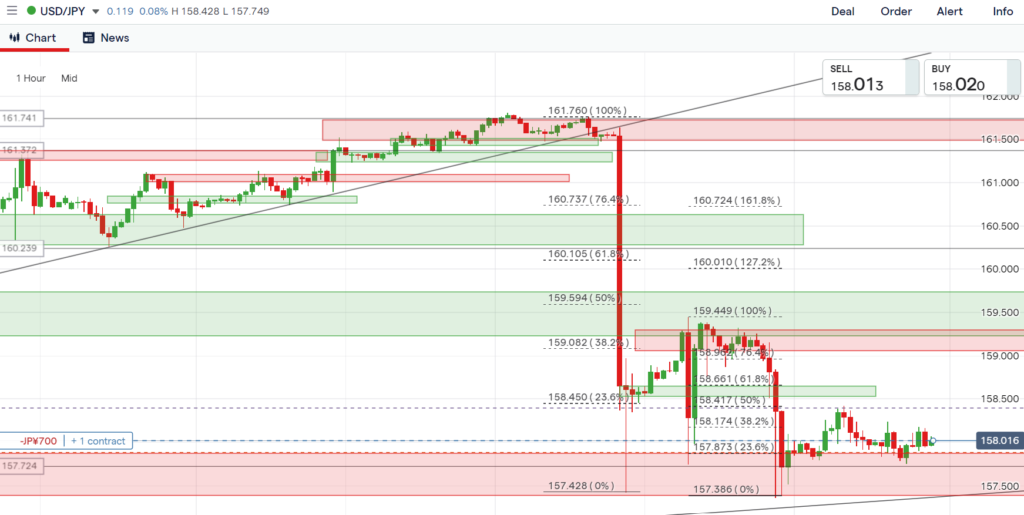
Price has broken stucture and created a higher high and higher low. Price has hit the supply zone and is retracing. It is still bearish. Wait for the price to finish its retracement, then enter for a buy.
Go down to the 15 mins timeframe to observe the price action.
Update
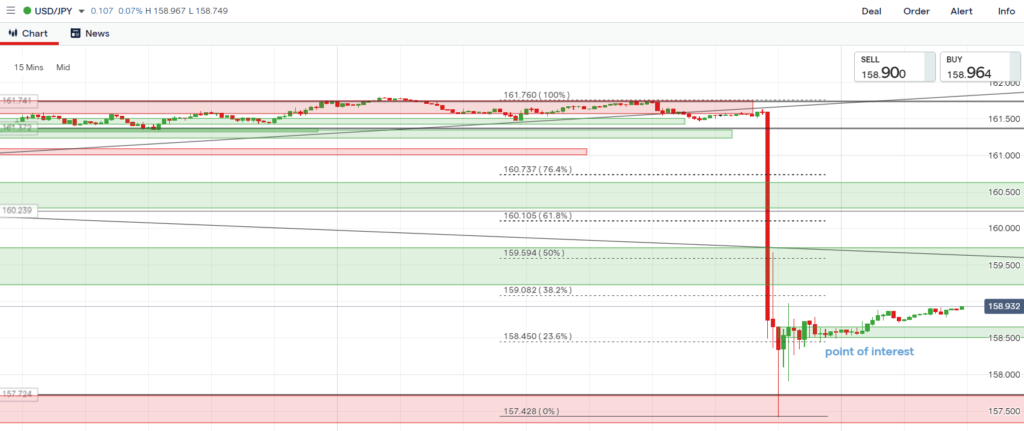
Wait and see what the price will do at this point. Look for a buy if it comes back down to the point of interest, i.e. major key level.
Set alert at 158.595.
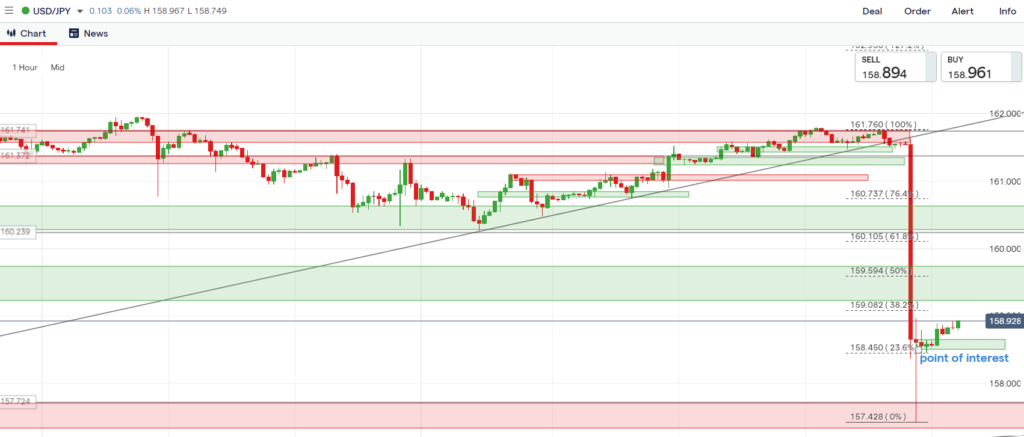
1 hour timeframe on 15 July. Price has come back down to re-test the major key level. Price is bearish.
15 Mins Timeframe
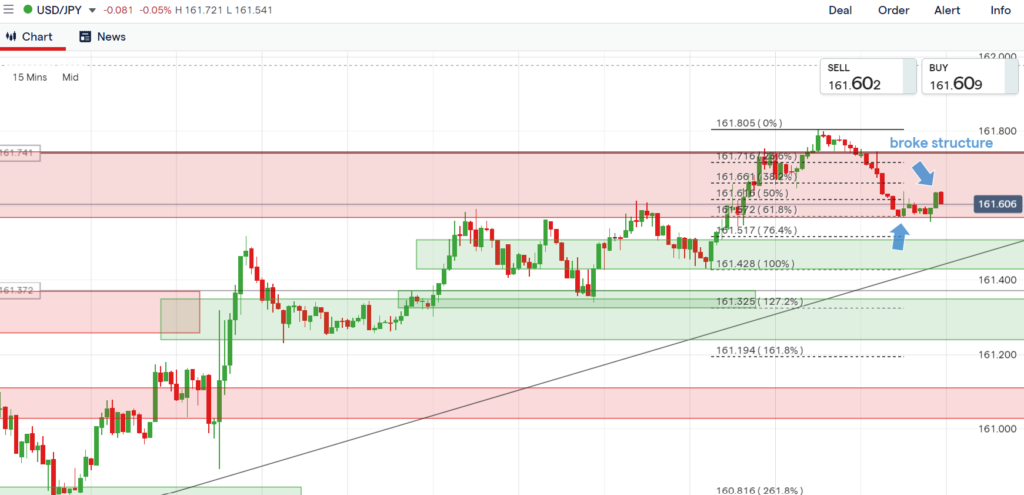
Price has broke structure in the mini timeframe.
Set alert at 161.28 and 161.46.
Update
Wait and see where price will go at this point.
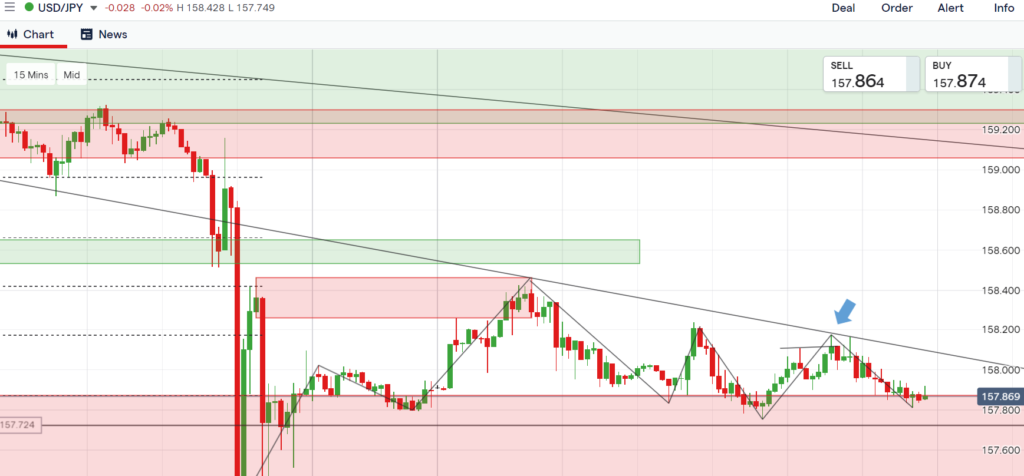
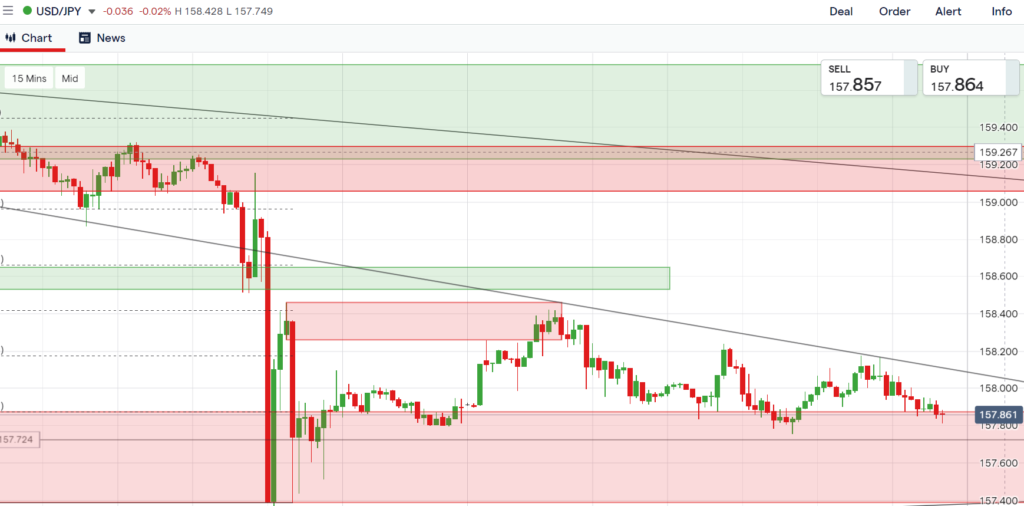
15 min timeframe on 15 July. Price is in a downtrend. Note to self: Why did you buy?
Lessons Learnt
Don’t enter for a buy when the prices in all the timeframes are still in a bearish order flow. Wait for confirmation that prices have turned bullish, i.e. prices have broken market structure.
15 Mins Timeframe
The 15 mins timeframe shows lower highs and lower lows. I’ve mistaken the last lower high (blue arrow) as a break of structure, which is wrong.
